graylog-alerts-to-icinga
Monitor graylog alerts with icinga2
This python script checks the Graylog event stream for entries. If an Altert has been triggered, a Critical message is sent to Icinga2. The monitoring of icinga2 is thus connected to Graylog.
Graylog is a log monitoring tool. Icinga is a tool for machine monitoring.
Features
- debugging
- customizations can be done via Graylog
- query search to not show alerts that should not trigger anything
- customize search time or restrict to specific machines/hosts
- fully compatible with Graylog 4
- Session authentication
- works with self-signed certificates
How it works
- Graylog Eventstream is queried via the API (:9000/api/events/search)
- In the Graylog eventstream there are usually only events that are worth watching
- By default, an alarm is triggered in icinga2 when an event is in the eventstream
- how well this plugin works depends very much on which alarms&events are configured in the Graylog
Prerequisites
- I strongly recommend to create a readonly monitoring user! See below how to do that.
- Python module requests: pip3 install requests
- The Graylog GUI should be accessible via https. A self-signed certificate is sufficient. However, the plugin also works without encryption.
- Port 9000 must be enabled in the firewall.
Installation
- Download check_graylog_alerts.py to your local Graylog server
- Put the Python script to your Pluginfolder. Usually /usr/lib/nagios/plugins/
- Create a new command custome command:
object CheckCommand "check_graylog_alerts" {
    import "plugin-check-command"
    command = [ PluginDir + "/check_graylog_alerts.py" ]
    arguments += {
        "--host" = {
            description = "hostname"
            required = true
            value = "$address$"
        }
        "--machine" = {
            description = "machine to check for in graylog stream  (default: all, if not set)"
            required = false
        }
        "--password" = {
            description = "Graylog Userpassword"
            required = true
        }
        "--query" = {
            description = "graylog search query (default: show all queries if not set)"
            required = false
        }
        "--time" = {
            description = "timerange to check since now in seconds (default 86400 if not set)"
            required = false
        }
        "--user" = {
            description = "Graylog Username"
            required = true
        }
    }
}
- Create a new Service object:
object Service "Service: Graylog Alerts" {
   import               "generic-service"
   host_name =          "YOUR GAYLOG HOST"
   check_command =      "check_graylog_alerts"
}
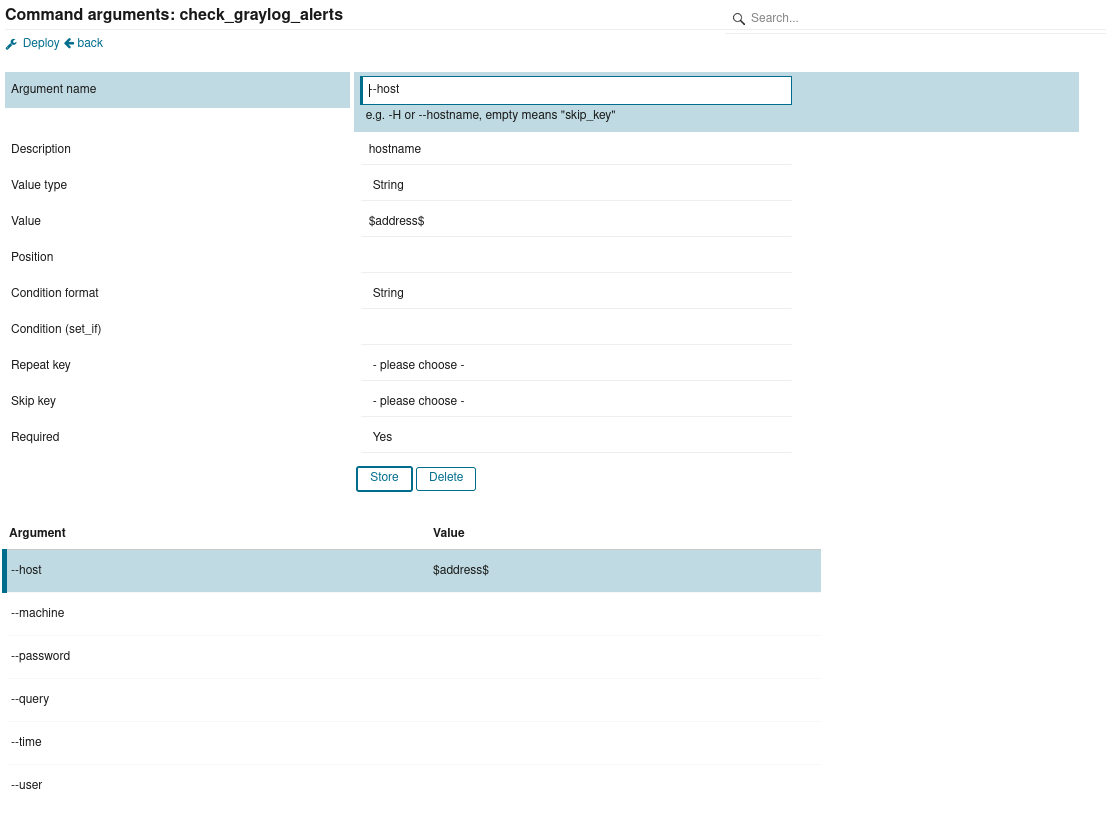
icinga director
- Create a custome command with following arguments:

CLI Usage
python3 check_graylog_alerts.py -hwill show you a manual.
Usage: check_graylog_alerts.py [options]
check_graylog_alerts.py checks graylog stream for alerts. you need to setup alerts beforehand.
Example: check_graylog_alerts.py -H 192.168.134.11 -u admin -p secret -m testmachine -t 33
Options:
  -h, --help            show this help message and exit

  Generic options:
    -d, --debug         enable debugging outputs (default: no)

  Host options:
    -H HOST, --host=HOST
                        defines graylog  hostname or IP

  User options:
    -u USER, --user=USER
                        graylog user with access to API and event stream
                        (default: admin)

  Password options:
    -p PASSWORD, --password=PASSWORD
                        graylog user password (default: none)

  Machine options:
    -m MACHINE, --machine=MACHINE
                        machine to check for in graylog stream  (default: all)

  Timerange options:
    -t TIMERANGE, --time=TIMERANGE
                        timerange since now in seconds (default 86400)

  Query options:
    -q QUERY, --query=QUERY
                        graylog search query (default: show all queries)
Create a readonly monitoring user
-
In Graylog, open the System tab and select "Users and Teams".
-
Create a new user with assigend role: "View Manager"

-
Share your "All Events" Stream with the new user

-
Add your newly created user. Leave the rights at "Viewer".

License
Licensed under the terms of Apache License Version 2. See LICENSE file.