check_drupal
check_drupal
Nagios drupal plugin to monitor the state of a drupal site and/or drupal multisite for security updates, system updates, core errors, core warnings and missing database migrations.

![]()
![]()
 |
Find more plugins at Awesome Nagios |
|---|---|
 |
Find more plugins at Icinga Exchange |
 |
Find more plugins at Nagios Exchange |
Tested on
- Drupal 6
- Drupal 7
- Drupal 8
Overview

Details
NOTE
This check can be used in two ways:
- Let nagios always trigger
check_drupalwhich might take 1-3 seconds and cause some load - Let nagios simply parse the logfile (with
check_drupal_log) created bycheck_drupalvia cron on the target machine.
I would recommend the second option as you do not check each drupal site every 5 minutes and also in order to keep the nagios check as fast as possible. For that use cron to trigger the check_drupal on the target machine every 6 hours or so.
Requirements
| Program | Required | Description |
|---|---|---|
| bourne shell (sh) | yes | The whole script is written in pure bourne shell (sh) and is 100% Posix compliant |
| check_by_ssh or NRPE |
yes | check_by_ssh is used as a wrapper to check on remote hosts. Alternatively you can use NRPE as reported here: Issue #2 |
| drush | yes | This nagios plugin requires drush to be installed on the target machine |
Features
- Multisite support
- Check for Drupal security updates
- Check for Drupal system updates
- Check for Drupal required database migrations
- Check for Drupal core errors
- Check for Drupal core warnings
- Every check can specify its own nagios severity (Error or Warning)
- Custom name for nagios short output
- Be able to don't show updates that are locked via drush
- Detailed information in nagios long output
- Be able to successfully recognize valid Drupal6 or Drupal7 document root
- Basic performance data fow: how many OKs, Errors, Warnings and Unknowns
1. Usage
1.1 check_drupal
With -l you will be able to run the check_drupal locally on each machine only a few times a day and dump the output to a logfile.
This file can then be checked normaly via nagios by calling check_drupal_log instead, which will just read the log and not put any load onto the machine.
Multiple logfiles for multiple drupal site per server will be possible.
Usage: check_drupal -d  [-n ] [-s ] [-u ] [-e ] [-w ] [-m ] [-i ] [-l ] [-r]
OR     check_drupal --check
OR     check_drupal --help
OR     check_drupal --version

Nagios plugin that will check drupal sites for errors.
Errors include the following: available security updates,
missed database migrations and drupal status errors.
For each check you can specify the nagios severity (error or warning).

  -d        The full path to the drupal document root (usually
                         the 'drupal' folder. This parameter is required.

  -n               [optional] Specify a name for the drupal instance to
                         appear on the nagios output. The default is 'Drupal'

  -s                [optional] Check for drupal core and module security
                         updates and return nagios error or warning.
                         Warning:  -s w
                         Error:    -s e

  -u                [optional] Check for drupal core and module updates
                         in general and return nagios error or warning.
                         Warning:  -u w
                         Error:    -u e

  -e                [optional] Check for drupal status errors and return
                         nagios error or warning.
                         Warning:  -e w
                         Error:    -e e

  -w                [optional] Check for drupal status warnings and return
                         nagios error or warning.
                         Warning:  -w w
                         Error:    -w e

  -m                [optional] Check for drupal missed database migrations
                         and return nagios error or warning. (They can occur
                         when you update core or modules and forget the db).
                         Warning:  -m w
                         Error:    -m e

  -i                [optional] Parse in an url for a drupal multisite instance.
                         'drush --uri':
                         In Drupal 7, the value of --uri should always be
                         the same as when the site is being accessed from a web browser
                         (e.g. http://mysite.org, although the http:// is optional).
                         In Drupal 6, the value of --uri should always be the same as the
                         site's folder name in the 'sites' folder (e.g. default); it is best
                         if the site folder name matches the URI from the browser, and is consistent
                         on every instance of the same site
                         (e.g. also use sites/mysite.org for http://dev.mysite.org).

  -l           [optional] Instead of checking all of the above via nagios
                         every five minutes or so, run this script via cron once a day
                         (or twice) and write the output into a logfile. This logfile can
                         then be checked by the nagios plugin 'check_drupal_log' which is
                         less costy in terms of load/cpu.
                         See 'check_drupal_log --help' for more info.
                         Example:
                         check_drupal -d /var/www -s e -e e -w w -l /var/log/drupal.log
                         check_drupal_log -l /var/log/drupal.log

  -r                     [optional] Filters all updates that are locked via drush.
                         For general infos about locking run 'drush pm-updatestatus -h'

  --check                Check for program requirements.
  --help                 Show this help
  --version              Show version information.
1.2 check_drupal_log
Usage: check_drupal_log -f
OR     check_drupal_log --help
OR     check_drupal_log --version

Nagios plugin that will parse the logfile created by 'check_drupal'.

  -f            The full path to logfile created by 'check_drupal'

  --help                 Show this help
  --version              Show version information.
2. Examples
The following examples are run directly from the command line. The exit code will always be aggregated, meaning if the program throws a warning and an error, the final exit code will result in an error.
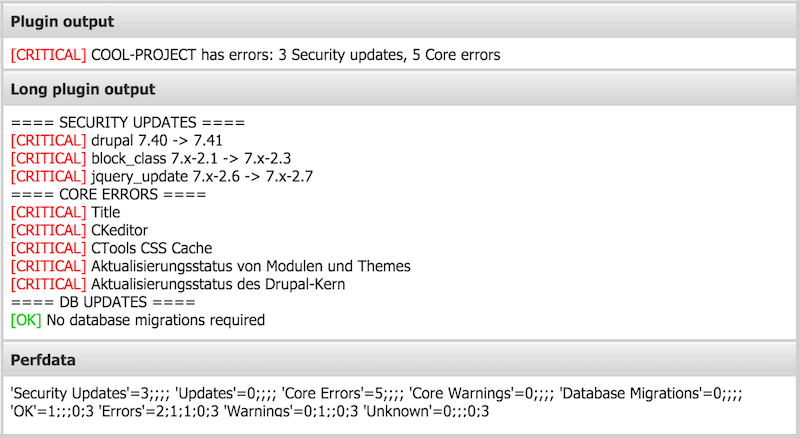
Also to note: The first line until the | represents the actual nagios output. Everything in the first line behind the | is performance data used to generate the cool charts. Everything from line two onwards is nagios extended status info (when you click on details).
Check for security updates
./check_drupal -d /shared/httpd/sites-drupal/COOL-PROJECT/drupal/ -n COOL-PROJECT -s e
[CRITICAL] COOL-PROJECT has errors: 2 Security updates | 'Security Updates'=2;;;; 'Updates'=0;;;; 'Core Errors'=0;;;; 'Core Warnings'=0;;;; 'Database Migrations'=0;;;; 'OK'=0;;;0;1 'Errors'=1;1;1;0;1 'Warnings'=0;1;;0;1 'Unknown'=0;;;0;1
==== SECURITY UPDATES ====
[CRITICAL] drupal 7.40 -> 7.41
[CRITICAL] jquery_update 7.x-2.6 -> 7.x-2.7
Check for security and normal updates
./check_drupal -d /shared/httpd/sites-drupal/COOL-PROJECT/drupal/ -n COOL-PROJECT -s e -u w
[CRITICAL] COOL-PROJECT has errors: 3 Security updates, 3 Updates | 'Security Updates'=3;;;; 'Updates'=3;;;; 'Core Errors'=0;;;; 'Core Warnings'=0;;;; 'Database Migrations'=0;;;; 'OK'=0;;;0;2 'Errors'=1;1;1;0;2 'Warnings'=1;1;;0;2 'Unknown'=0;;;0;2
==== SECURITY UPDATES ====
[CRITICAL] drupal 7.40 -> 7.41
[CRITICAL] block_class 7.x-2.1 -> 7.x-2.3
[CRITICAL] jquery_update 7.x-2.6 -> 7.x-2.7
==== SYSTEM UPDATES ====
[WARNING] field_collection 7.x-1.0-beta9 -> 7.x-1.0-beta10
[WARNING] views 7.x-3.11 -> 7.x-3.13
[WARNING] bootstrap 7.x-3.0 -> 7.x-3.4
Check for all possible stuff
./check_drupal -d /shared/httpd/sites-drupal/COOL-PROJECT/drupal/ -n COOL-PROJECT -s e -u w -e e -w w -m e
[CRITICAL] COOL-PROJECT has errors: 3 Security updates, 3 Updates, 5 Core errors, 1 Core warning | 'Security Updates'=3;;;; 'Updates'=3;;;; 'Core Errors'=5;;;; 'Core Warnings'=1;;;; 'Database Migrations'=0;;;; 'OK'=1;;;0;5 'Errors'=2;1;1;0;5 'Warnings'=2;1;;0;5 'Unknown'=0;;;0;5
==== SECURITY UPDATES ====
[CRITICAL] drupal 7.40 -> 7.41
[CRITICAL] block_class 7.x-2.1 -> 7.x-2.3
[CRITICAL] jquery_update 7.x-2.6 -> 7.x-2.7
==== SYSTEM UPDATES ====
[WARNING] field_collection 7.x-1.0-beta9 -> 7.x-1.0-beta10
[WARNING] views 7.x-3.11 -> 7.x-3.13
[WARNING] bootstrap 7.x-3.0 -> 7.x-3.4
==== CORE ERRORS ====
[CRITICAL] CKeditor
[CRITICAL] Cron-Wartungsaufgaben
[CRITICAL] CTools CSS Cache
[CRITICAL] Aktualisierungsstatus von Modulen und Themes
[CRITICAL] Aktualisierungsstatus des Drupal-Kern
==== CORE WARNINGS ====
[WARNING] Token
==== DB UPDATES ====
[OK] No database migrations required
Check for db updates
./check_drupal -d /shared/httpd/sites-drupal/COOL-PROJECT/drupal/ -n COOL-PROJECT -m e
[OK] COOL-PROJECT is healty | 'Security Updates'=0;;;; 'Updates'=0;;;; 'Core Errors'=0;;;; 'Core Warnings'=0;;;; 'Database Migrations'=0;;;; 'OK'=1;;;0;1 'Errors'=0;1;1;0;1 'Warnings'=0;1;;0;1 'Unknown'=0;;;0;1
==== DB UPDATES ====
[OK] No database migrations required
3. Nagios Configuration
3.1 check_drupal
Command definition
In order to check drupal sites on remote servers you will need to make use of check_by_ssh.
name:    check_by_ssh_drupal
command: $USER1$/check_by_ssh -H $HOSTADDRESS$ -t 60 -l "$USER17$" -C "$USER22$/check_drupal -d $ARG1$ -n $ARG2$ $ARG3$"
Service definition
In the above command definition there are two fixed arguments for the document root and the project name as well as one loose argument place holder that can hold all checks you want to run. The following shows one example service definition for one specific drupal site:
check command: ssh_drupal_cool-drupal-project
$ARG1$:        /var/www/cool-drupal-project/drupal/
$ARG2$:        Cool Drupal Project
$ARG3$:        -s e -u w -e e -w w -m e
The above service definition will check against security updates (with nagios error), against normal updates (with nagios warning), against core errors (with nagios error), against core warnings (with nagios warning) and finally against missed database migrations (with nagios error).
3.2 check_drupal_log
Command definition
In order to check drupal sites on remote servers you will need to make use of check_by_ssh.
name:    check_by_ssh_drupal
command: $USER1$/check_by_ssh -H $HOSTADDRESS$ -t 60 -l "$USER17$" -C "$USER22$/check_drupal_log -f $ARG1$"
Service definition
In the above command definition there is only one argument. This will point to the logfile created by check_drupal:
check command: ssh_drupal_cool-drupal-project
$ARG1$:        /var/log/drupal_cool-project.log
Cron setup
For this recommended setup to work you need to setup a cronjob on the target machine (where the drupal site is installed) that is run every 6 hours, every day or whatever you want.
Setup multiple cronjobs with multiple logfiles if you have multiple drupal sites on this machine that you want to monitor.
0 */6 * * * /path/to/check_drupal -d /var/www/cool-drupal-project/drupal/ -n "Cool Project" -s e -u w -e e -w w -m e -l /var/log/drupal_cool-project.log4. Icinga2 Configuration
4.1 check_drupal
Command definition
Because icinga2 should be running on every monitored server, there is no need for check_by_ssh.
object CheckCommand "check_drupal" {
    import "plugin-check-command"

    command = [ PluginDir + "/check_drupal" ]

    arguments = {
        "-d" = "$drupal_root$"
        "-n" = "$name$"
        "-s" = "$s$"
        "-u" = "$u$"
        "-e" = "$e$"
        "-w" = "$w$"
        "-m" = "$m$"
    }
}
Service definition
The following shows an example service definition for one specific drupal site:
apply Service "check_cool-drupal-project" {
    import "generic-service"

    check_command = "check_drupal"

    vars.drupal_root = "/var/www/cool-drupal-project/drupal/"
    vars.name = "Cool Drupal Project"
    vars.s = "e"
    vars.u = "w"
    vars.e = "e"
    vars.w = "w"
    vars.m = "e"

    assign where host.name == NodeName
}
The above service definition will check against security updates (with nagios error), against normal updates (with nagios warning), against core errors (with nagios error), against core warnings (with nagios warning) and finally against missed database migrations (with nagios error).
4.2 check_drupal_log
Command definition
object CheckCommand "check_drupal_log" {
    import "plugin-check-command"

    command = [ PluginDir + "/check_drupal_log" ]

    arguments = {
        "-f" = "$logfile$"
    }
}
Service definition
In the above command definition there is only one argument. This will point to the logfile created by check_drupal:
apply Service for (logfile => config in host.vars.logfile) {
    import "generic-service"

    check_command = "check_drupal_log"

    vars += config
}
The above service definition will look for multiple "vars.logfile" in your host.conf:
vars.logfile["drupal name1"] = { logfile = "/var/log/check_drupal/name1.log" }
vars.logfile["drupal name2"] = { logfile = "/var/log/check_drupal/name2.log" }
vars.logfile["drupal name3"] = { logfile = "/var/log/check_drupal/name3.log" }
Cron setup
For this recommended setup to work you need to setup a cronjob on the target machine (where the drupal site is installed) that is run every 6 hours, every day or whatever you want.
Setup multiple cronjobs with multiple logfiles if you have multiple drupal sites on this machine that you want to monitor.
0 */6 * * * /path/to/check_drupal -d /var/www/cool-drupal-project/drupal/ -n "Cool Project" -s e -u w -e e -w w -m e -l /var/log/drupal_cool-project.log5. Performance data
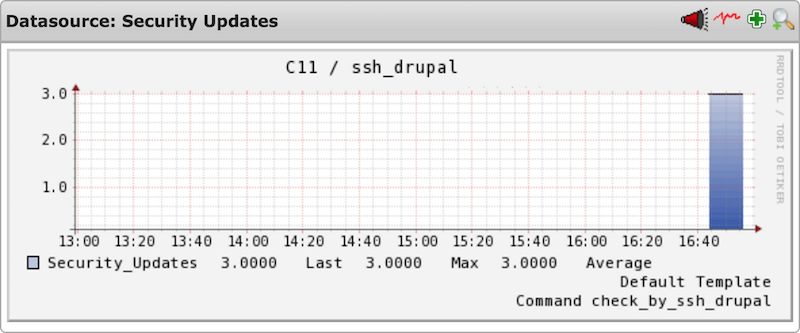
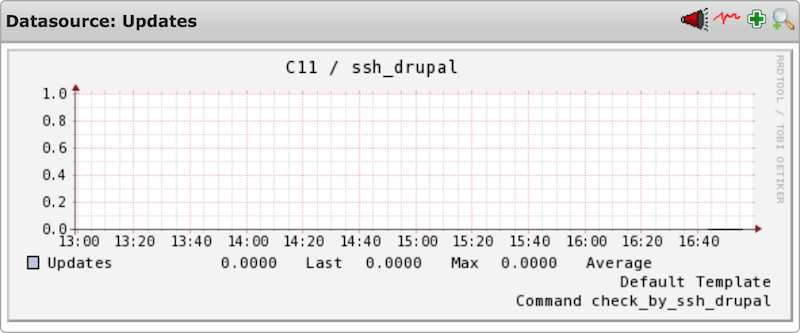
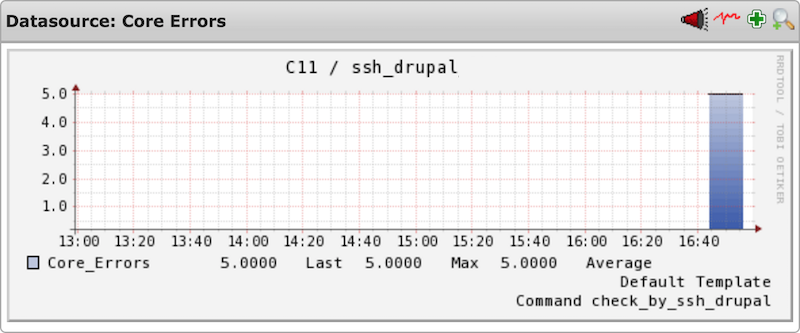
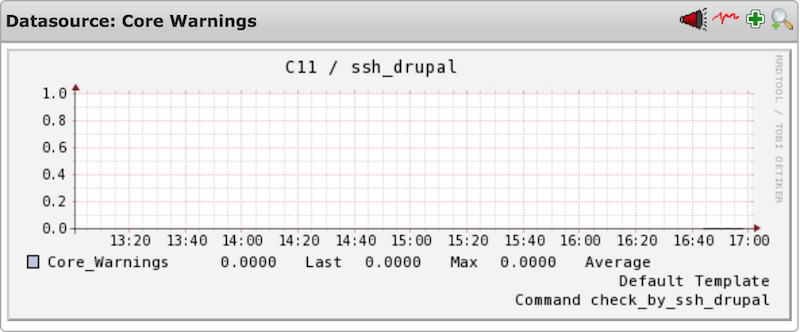
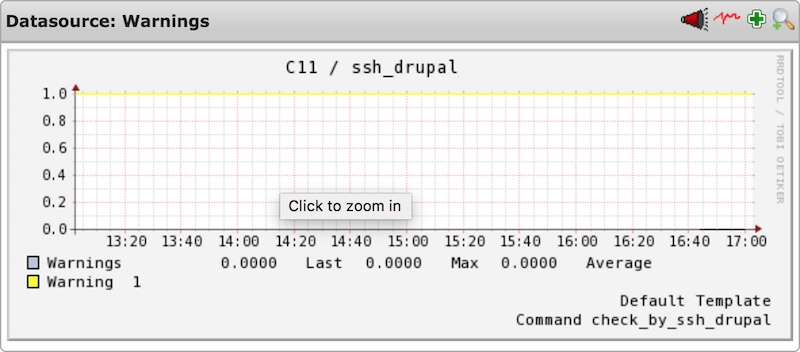
Screenshots taken from an Icinga setup
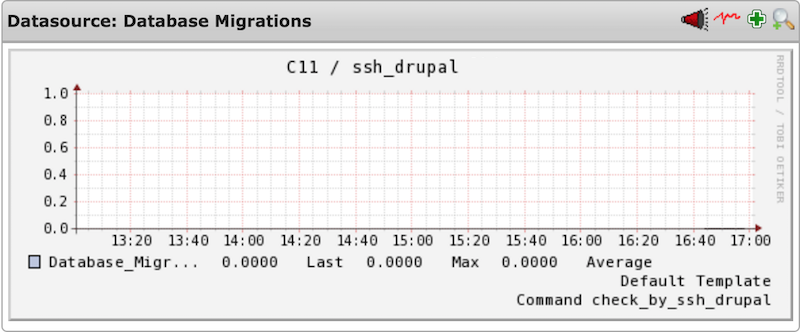
5.1 Specific data
The following performance data gives detailed information about specific errors/warnings that have occured
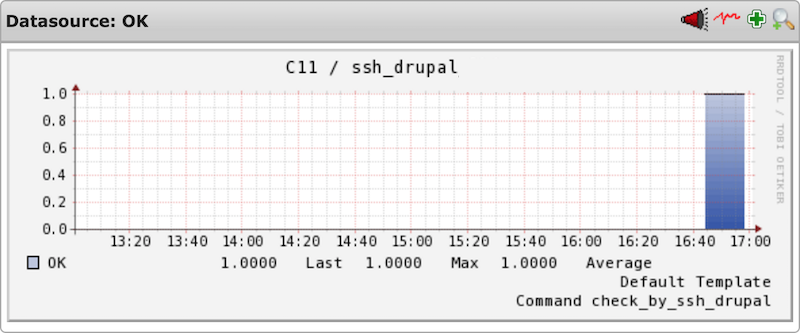
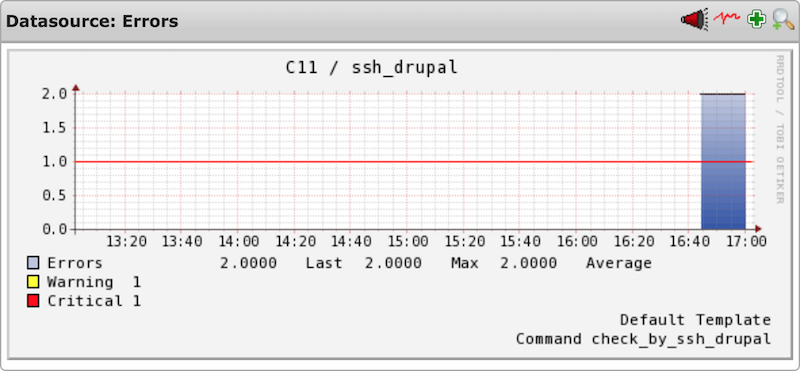
5.2 General data
The following performance data gives a general overview about how many OK's, Errors, Warnings and Unknowns have happened over time. This way you can also see how quickly the reaction time has been to occured problems.
Best practise:
- OK: should always be a high vertical line
- Error: Should only have short peaks
- Warning: Should only have short peaks
- Unknown: Should never happen

6. License
7. Awesome
Added by the following ![]() lists:
lists: